Optimizing Python Code - Profiling
Why bother optimizing?
Python is well-known to be slower than compiled languages. A published paper entitled “Energy Efficiency across Programming Languages” estimates that Python uses up to 75 times the energy that a C program does. Most data scientists do not have the flexibility to switch to a different programming language, but they don’t need to accept Python’s poor performance as there are always ways to speed up a piece of code. I have repeatedly helped people from junior to PhD-level developers with the optimization of code. Genreally you just need the acceptance that your code might be slow and the willingness to do something about it. The optimization process usually involves the following two steps:
- Profiling Find out where your program is spending its execution time
- Optimizing Rewrite that portion of the code to reduce run time
Optimization is tricky. Sometimes the solution is obvious (axing deep nested for-loops, lack of vectorization, memoization, etc.). Other times it either involves having experience to identify slow code or finding a fortunate StackOverflow post that happens to compare the performance on similar code. Profiling however is something that anyone can (and should) do. Your time is the most valuable resource and there is no need to waste it waiting for inefficient code to run. Faster code allows you to develop and debug faster, uses less energy, and lets you focus on what is most important.
Getting started with profiling
I prefer to use the cProfile module as it is preinstalled with python (see alternatives at docs.python.org). Profilers are intended for benchmarking purposes as they add some overhead while they track the execution profile. They are helpful for relative comparissons of two code blocks and to check where your code spends the largest percentage of the execution time. Profiling requires two steps:
- Run some python code with the profiling module enabled
- Visualize the results
Profiling statements in code
You can run the following sample script to profile a simple regex call and display the profiled results:
import cProfile
import re
cProfile.run('re.findall("\d", "abc456")')
>>> cProfile.run('re.findall("\d", "abc456")')
         6 function calls in 0.000 seconds

   Ordered by: standard name

   ncalls  tottime  percall  cumtime  percall filename:lineno(function)
        1    0.000    0.000    0.000    0.000 <string>:1(<module>)
        1    0.000    0.000    0.000    0.000 re.py:214(findall)
        1    0.000    0.000    0.000    0.000 re.py:286(_compile)
        1    0.000    0.000    0.000    0.000 {built-in method builtins.exec}
        1    0.000    0.000    0.000    0.000 {method 'disable' of '_lsprof.Profiler' objects}
        1    0.000    0.000    0.000    0.000 {method 'findall' of '_sre.SRE_Pattern' objects}
These results are not terrible exciting since the code we profiled ran fast and didn’t do much. The code block also consists of internal python modules and there is no custom code. There are more insights to be gained when profiling larger scipts or modules. The following is a breakdown of the result columns:
- ncalls is the number of calls to a line
- tottime is the time inside the function alone
- percall is the tottime divided by ncalls
- cumtime is the total time inside the function including all of its subcalls
- percall is the cumtime divided by ncalls
- the last column shows the filename, line number and the function of the statement
Now that you know how to profile a simple code block, let’s set up Visual Studio Code to create a profiling launch profile. This launch profile will be used along your software development practices to profile developed code.
Setting up the profiler in Visual Studio Code
In this section, Visual Studio Code will be set up with a profiler and run/optimize a code sample. It is more convenient to add the profiler as a new launch profile in the Visual Studio Code launch.json rather than profile each code individually. If you did want to run the profiler on your code from a console manually, then you could simply run the following console command:
python -m cProfile -o ./code_profile.prof path/to/your/script
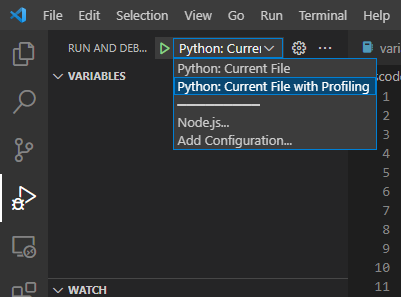
Begin with an open project folder that you want to profile. Profiling should be done occasionally on the side as it slows down the execution of the code. Therefore it is best that a new configuration for profiling below the main one that will be used for constant code execution. Press [Ctrl]+[Shift]+[P] and type “open launch.json”. You should have a launch.json already created and the following configuration should be added:
{
	"name": "Python: Current File with Profiling",
	"type": "debugpy",
	"request": "launch",
	"module": "cProfile",
	"args": [
		"-o", "./code_profile.prof", "${file}"
	]
}
The current working directory (“cwd”) can be customized to fit the project and other arguments can be added as needed. The args parameters will save the results into the code_profile.prof file in the same folder. The profile result data in code_profile.prof can be visualized later.
Result visualization via Snakeviz
I personally like visualizing the results in snakeviz, which can be installed via pip:
pip install snakeviz
The following code snipped genereates two random matrices, finds the largest values along one axis, and adds the results. It was saved as sample.py file and profiled with the “Python: Current File with Profiling” configuration:
import numpy as np

def get_random_data(n:int)->np.ndarray:
    k = np.random.randint(n, size=(100,100))
    return np.max(k, axis=1)

def add_random_data(a:np.ndarray, b:np.ndarray)->np.ndarray:
    return a + b

for k in range(0, 10000):
    a = get_random_data(2)
    b = get_random_data(20)
    c = add_random_data(a,b)
Note that the code needs to be run to completion before the output file is genereated. An exception or keyboard interrupt will prevent the creation of the result file. The profiling data can be visualized by typing the following into a console:
snakeviz ./code_profile.prof
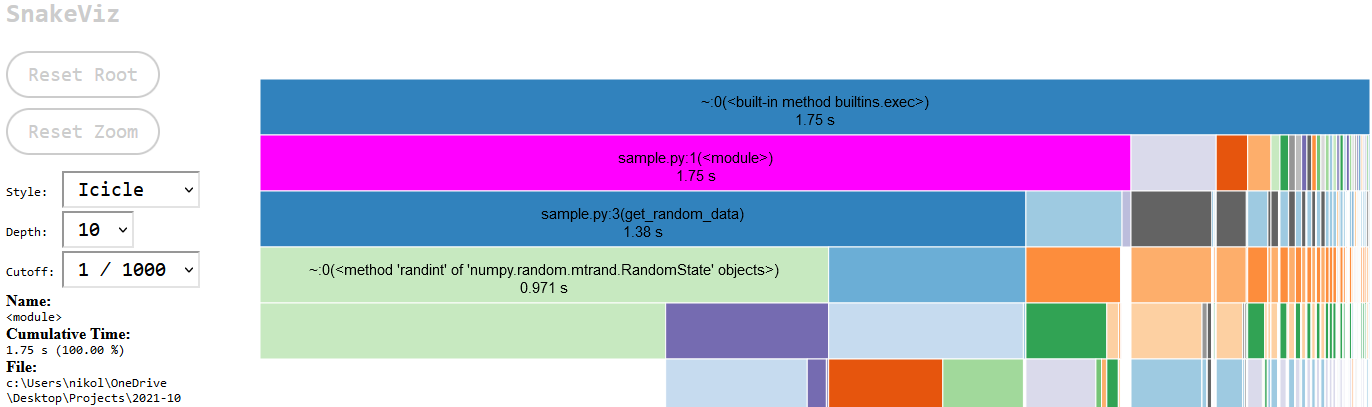
A new browser should open up and visualize the results as a barchart that shows the relative durations of your functions as bar chart. Any function that takes a lot of time will be very prominent in this view. The full duration of sample.py was 1.75 seconds. Below the bar chart are the cProfile tabular results. The tabular data shows the number a function/line was called and the execution time. The bar chart is interactive. The function name of a bar and its execution time will be displayed on the left hand-side text box when it is hovered over by the mouse pointer. Anything below a bar are the function calls that are called by the function represented by the bar. Click on the sample.py bar (highlighted in magenta) to zoom in on that script only and remove the built-in functions/import execution bars displayed on the left. Those are not terribly important for most profiling and just clutter up the screen.
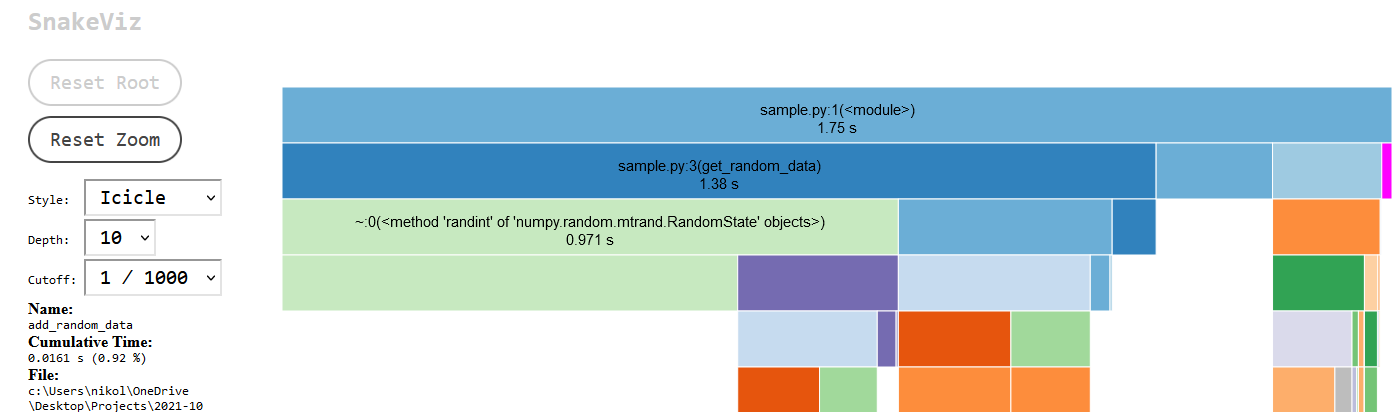
This view shows the sample.py function calls. The zoom level can be reset by cliking the “Reset Zoom” button. This zoomed-in view shows that the script spend 1.38s in get_random_data. The table below shows that get_random_data was called 20,000 times which makes sense as it is called in the for-loop twice. The bar below the get_random_data function shows the breakdown of the subcalls that were made. The random data generation took 0.971s and the calculation of the max value took 0.337s.
Highlighted in magenta and barely visible is the add_random_data function function which ran 10,000 times and cumulatively took up only 0.016s. If this was a real optimization effort, then you would know where your execution time is spend. The next step would be to decide whether you can accelerate portions of your code and whether that effort will be worth it. An additional profiling run can be performed to figure out if a rewrite worked to speed up the code.
Conclusions
This post showed you how to use cProfile to profile a code chunk or how to profile a full python file/script. The resulting profile was visualized in SnakeViz and it was shown how to use the visualization to identify where a function spends most of its execution time. It is strongly recommended that profiling is used as part of your software development efforts to free up time and save you money.