
Bootstrap Sampler
What if you modified a process and you needed to know whether a change occured? Being a good data scientist you collected a baseline measurement, pushed the change into production, and monitored the process for some time. This is the data you collect and now you need to know if the modification had any effect.
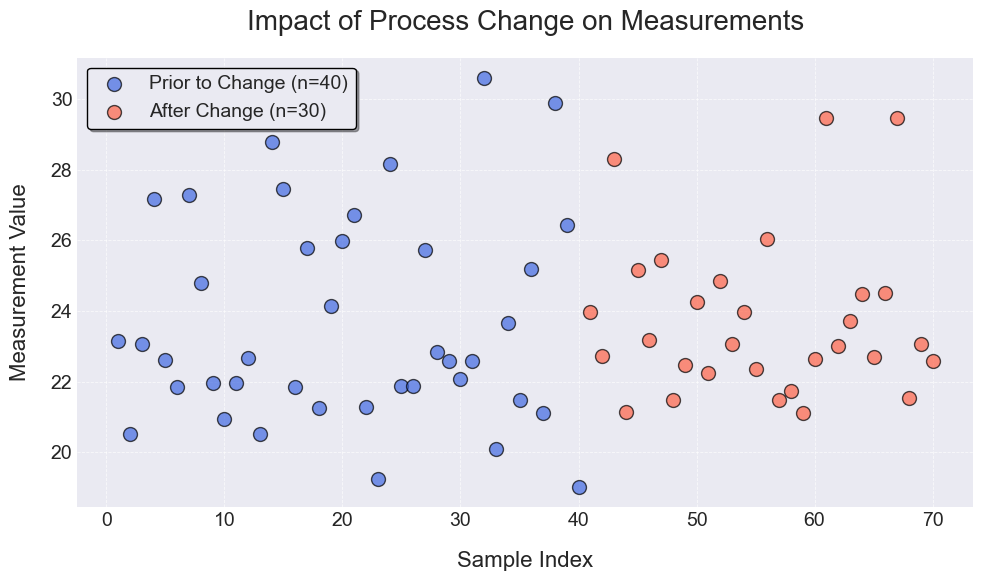
If you squint, you can sort of see that the process has shifted, but how can you be sure? You might remember statistical tests, but what if the data is not normally distributed? Or if you have a small sample size? You cannot always rely on assumptions from parameteric equations when dealing with real-world data.
The bootstrap sampler is a resampling technique that allows the estimation of any statistic with confidence bounds without any conditions on the distribution of the data. The only assumption that the technique makes is that the sample that you have is representative of the population. If the sample is biased or contains a weird outlier, then the results will be biased as well.
Bootstrap Sampling
When you have a sample of data and calculate the mean for it, you are calculating a single number with no way of knowing how variable that number is and how confident you should be.
- In bootstrap sampling you start with your original data of (for example) 40 numbers and put them into a hat
- You draw 40 numbers with replacement and calculate the mean for the current number set
- Then you repeat this process say 1,000s of times and calculate the mean each time
- You now have a distribution of means that you can use to estimate the variability of the mean and a confidence interval around it.
This sounds like it shouldn’t work and that is why the method was called bootstrap resampling because it seems like pulling yourself up by your bootstraps implying self-sufficiency. Pulling oneself up by your bootstraps is not physically possible, but the boostrap method has been shown to work and is a powerful tool to help you make sense of real-world measurements.
Process Change Example
In the above example I have a process with 40 measurements before and 30 points after a change. How can I determine whether a significant change occured? I can use the bootstrap sampler and the following tool to estimate the variability of the mean and the median and confidence intervals around them.
The values will vary a bit every time the process is run, but the results show the following:
- Sample 2 (after the change) has a higher mean and median than Sample 1 (before the change)
- The confidence intervals are overlapping, which means that it is hard to say which mean is higher with confidence
We can go a step further though. What if we want to know if the change was significant? We can resample both samples 10,000 times and check which mean is higher in each resample. This will tell us how often the mean of Sample 2 is higher than the mean of Sample 1. This will give us an idea of how significant the change potentially was.
In this case the results show that the mean of Sample 1 is higher only about 5% of the time. This is a significant result and we can conclude that the change had an effect on the process and that the mean after the change (sample 2) is higher than the mean before the change (sample 1). The truth is the above data was sample from a process where the mean has only shifted by 1 units and the data is skewed so the median is a better measure of central tendency. The sample size is small so we have to be careful with our conclusions, but the results do show the strength of the bootstrap sampler.
Bootstrap Sampling Tool
This widget allows you to perform bootstrap sampling on two datasets. Paste your samples below, specify the number of resamples, and the confidence interval, and click “Run Bootstrap.”